I have found that relying on tools like capinfos (figure 1) or the "bps" values in the TCP Conversations box in Wireshark (figure 2) to calculate the throughput of a TCP stream are unreliable.
$ capinfos test.stream-148.pcap | grep bit Data bit rate: 45 Mbps $ |
The "Conversations box in Wireshark reports the total number of bytes (A), the duration (B) and also the bps in each direction (C and D).
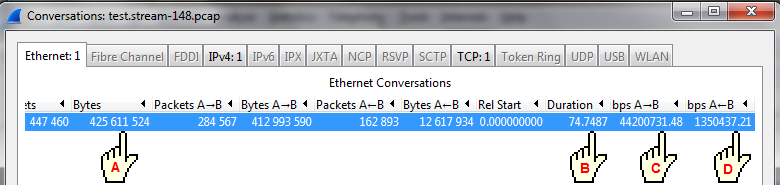
If we calculate bps as A/B * 8 we get 425611524 / 74.7487 * 8 or 45,551,189 bps. If we add up C and D we get almost the same number 44200731.48 + 1350437.21 = 45,551,168.
However, if we do our own calculation by looking at the last few segments and calculating throughput based on the actual number of bytes (relative sequence and acknowledgment numbers) we get a different number.
$ tshark -r test.stream-148.pcap -T fields -e frame.number -e frame.time_relative -e tcp.seq -e tcp .ack -e tcp.nxtseq | tail -15 447446 74.703074000 2257037 516867945 2257177 447447 74.703100000 516867945 2256897 447448 74.703176000 2257177 516867945 2257317 447449 74.703240000 2257317 516867945 2257457 447450 74.703306000 2257457 516867945 2257597 447451 74.703331000 516867945 2257177 447452 74.703331000 2257597 516867945 2257737 447453 74.703338000 516867945 2257457 447454 74.703423000 516867945 2257737 447455 74.703523000 516867945 2257737 516868065 447456 74.707328000 2257737 516868065 2257869 447457 74.707384000 2257869 516868065 2258009 447458 74.707455000 516868065 2258009 447459 74.709051000 2258009 516868065 2258141 447460 74.748734000 516868065 2258141 $ |
Looking at frame 447455 we can see that in 1 direction the last (next) sequence number is 516868065 which is ACKed in frame 447456 at time 74.707328000; so the throughput in that direction is 516868065 / 74.707328000 * 8 or 55,348,579. In the other direction we can see that in frame 447459 the last sequence number is 2258141 which is ACKed in frame 447460 at 74.748734000 for a throughput of 2258141 / 74.748734000 * 8 or 241,678. Giving a total of 55,590,257 or 22% (((55590257 - 45551189) / 45551189) * 100) larger than the capinfos or Wireshark Conversations box statistics.
If we wanted to be lazy we could have just looked at the last segment sending any data (frame 447459) and added the next sequence number with the acknowledgement number and divided by the time (((516868065 + 2258141) / 74.709051000) * 8) = 55,589,109. This isn't quite as accurate because we are basing 1 direction on an ACK number that may have been ACKed in an earlier frame. Still it is typically pretty close, in this case within 0.002% (((55590257 - 55589109) / 55590257) * 100) of the more accurate number.
So why does capinfos/Wireshark only report 45,551,168? The problem is that the trace file is not complete. There are 19,525 lost segment indications. Each indication means that at least 1 but possibly more than 1 segment is not in the trace so the bytes for those segments are not included in the calculation.
$ tshark -r test.stream-148.pcap -Y "tcp.analysis.lost_segment" | wc -l 19525 |
The capinfos/Wireshark information may also go the other way and be larger than the actual throughput.
$ capinfos stream-38288.pcap | grep bit Data bit rate: 10 Mbps $ tshark -r stream-38288.pcap -Y "tcp.len > 0" -T fields -e frame.number -e frame.time_relative -e tcp.seq -e tcp.ack -e tcp.nxtseq | tail -1 frame time since Relative Relative Calculated number begining Seq Ack Next Seq 61932 55.255709000 10277611 13551892 10277775 |
So using the actual sequence numbers gives a throughput of 3,450,093 bps ((13551892 + 10277775) / 55.255709 * 8) versus 10 Mbps from capinfos. Why? In this case there are a great many retransmissions, Wireshark is basically counting the data twice.
$ tshark -r stream-38288.pcap -Y "tcp.analysis.retransmission" | wc -l 14975 |
Even if there are no retransmissions or lost segments capinfos will still be wrong, or at least not correct. In this case 1387 kbps is 21% larger then the calculated 1142 kbps (((371209 + 148202) / 3.636076) * 8).
$ tshark -r test.stream-6.pcap -Y "tcp.analysis.retransmission||tcp.analysis.lost_segment" | wc - l 0 $ capinfos test.stream-6.pcap | grep bit Data bit rate: 1387 kbps $ tshark -r test.stream-6.pcap -Y "tcp.len > 0" -T fields -e frame.number -e frame.time_relative -e tcp.seq -e tcp.ack -e tcp.nxtseq | tail -1 1788 3.636076000 371169 148202 371209 |
In this case the difference is that capinfos/Wireshark includes the protocol overhead (well it was always including the protocol overhead). The Ethernet header is 14 bytes (if there is a VLAN ID it's 18 bytes). The standard IP header is 20 bytes. There are possible IP header options but they are not typically seen. The standard TCP header is also 20 byte but options are much more common. One of the most common options is the timestamp option which has a length of 10 bytes. The TCP stack may throw in some NOP options to make the timestamp option end of a word boundary. The TCP selective acknowledgment option will also add to the overhead. You can get the header length from tshark.
$ tshark -r test.stream-6.pcap -T fields -e tcp.hdr_len | sort -n | uniq -c 1789 32 |
So in this case all TCP segments have the same header length, 32 bytes, making the protocol overhead 14 (Ethernet header) + 20 (IP header) + 32 (TCP header) or 66 bytes. Figuring this into the throughput calculation ((371209 + 148202 + (1788*66)) / 3.636076) * 8 yields 1,402,432. Which is within 1% of the capinfos/Wireshark reported 1,387 kbps.
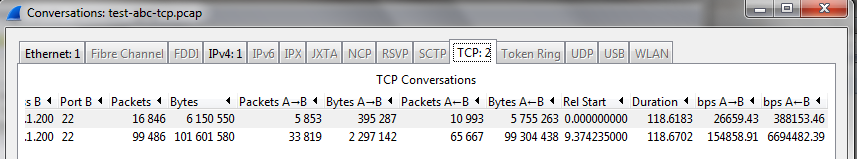
Also if the trace file contains more than 1 stream the capinfos information will show an aggregate "Data bit rate" and capinfos calculates the bit rate based on the duration of the entire trace, from the start of the first stream to the end of the last stream. The Conversations box will display the streams separately and bases its bit rate on the actual duration of each stream but of course includes the protocol bits and has issues with retransmitted and missing segments just described. In figure 9 you can see capinfos sees a 128 second trace with a bit rate of 6728Kbps. In figure 10 the Conversations box has 2 streams of 118 seconds each with bit rates of 414 (6150550/118.6183*8 ) and 6849Kbps (101601580/118.6702*8) for a total of 7261Kbps. While the actual throughput calculated by the segment numbers is 348Kbps and 6418Kbps for a total of 6766Kbps. In this case it appears that capinfos was pretty close but only by luck.
$ capinfos test-abc-tcp.pcap | grep -e bit -e duration Capture duration: 128 seconds Data bit rate: 6732 kbps |
$ tshark -r test-abc-tcp-stream-0.pcap -Y "tcp.len > 0" -T fields -e frame.number -e frame.time_relat ive -e tcp.seq -e tcp.ack -e tcp.nxtseq | tail -1 16845 118.572324000 5153894 8982 5154262 (((8982 + 5154262) / 118.572324000) * 8) = 348360 $ tshark -r test-abc-tcp-stream-1.pcap -Y "tcp.len > 0" -T fields -e frame.number -e frame.time_rel ative -e tcp.seq -e tcp.ack -e tcp.nxtseq | tail -1 99485 118.629696000 95170145 66673 95170241 (((6673 + 95170241) / 118.629696000) * 8) = 6418420 |
Finally, if the trace file contains other protocols the bits from those protocols will also be included by capinfos in its calculations. Figure 12 shows that capinfos reports a Data bit rate of 39 Mbps but as the output from the tshark command shows only 107,752,130 bytes of the capture are from TCP segments, the rest are UDP, 52,959,646 bytes and IP data, i.e IP fragments 544,365,464 bytes.
$ capinfos test-abc.pcap | grep -e bit -e duration
Capture duration:    144 seconds
Data bit rate:       39 Mbps

$ tshark -r test-abc.pcap -q -z io,phs

===================================================================
Protocol Hierarchy Statistics
Filter:

eth                                      frames:522562 bytes:705084976
  llc                                    frames:75 bytes:5316
    stp                                  frames:73 bytes:4380
    cdp                                  frames:2 bytes:936
  loop                                   frames:14 bytes:840
    data                                 frames:14 bytes:840
  slow                                   frames:5 bytes:620
  ip                                     frames:522452 bytes:705077240
    tcp                                  frames:116332 bytes:107752130
      ssh                                frames:78097 bytes:105228604
        tcp.segments                     frames:1 bytes:450
    data                                 frames:360703 bytes:544365464
    udp                                  frames:45417 bytes:52959646
      data                               frames:45417 bytes:52959646
  lldp                                   frames:4 bytes:240
  arp                                    frames:12 bytes:720
===================================================================
|
To be fair capinfos/Wireshark is not trying to measure just the TCP throughput but that means that if you want an accurate idea of the throughput of a TCP stream you need to calculate it using the actual sequence numbers and not rely on the summary information produced by capinfos/Wireshark.